
Mature software delivery organizations release often, with an automated or almost automated process. But we all know, the majority of large organizations have not reached that level of maturity yet, or at least not across their entire software landscape.
I worked for an organization that shipped major releases quarterly, and in my experience, release reports go like this:
The Release Manager organizes a weekly status meeting with the representatives of all the relevant stakeholders (Test Leads, Dev Leads, Operations, Configuration Managers, Environment Managers, etc.)
As soon as we get closer to the go-live, the frequency of that status meeting increases to 3 times a week (!) and its duration goes from 15 minutes to almost an hour.
The meeting minutes are sent by email to a looooooong list of stakeholders (developers, testers, release managers, operations, top management, etc.) with a status report structured like this:
- 1Release timeline, copy-pasted from a Powerpoint file
- 2Two-sentence status summary per team (Dev, Test, Infra, DB, Security, Code QA, etc.), based on the meeting discussions
- 3List of actions (who, when, and status) copy-pasted from an Excel file
- 4Deployment summary: what was and what will be released, on which environment, when, based on the meeting discussion
- 5Blocking and critical bugs, copy-pasted from Jira
- 6Open and resolved bugs speed comparison with the previous releases (copy-pasted from Excel using Jira report copy-pastes)

Bored by endless status meetings?
You get it, tons of copy-pastes. Of course, each meeting attendee has to be present for the whole meeting, even if her/his task is to communicate a single piece of information, already available somewhere.
Moreover, there is a fair chance that people interested in the meeting outcomes are going to miss the minutes in the flow of urgent emails. Which is a pity, because adding the time of all the meeting participants, it cost 10 hours to write.
Have you tried replacing a meeting with a Jira Dashboard?
Release Teams should be using a Release and Environment Management Tool. If this sounds logical to you, you're in good company, because the majority of Release Managers are happy working from spreadsheets.
There are many tools out there (Digital.ai, Plutora, Micro Focus, CA Release, etc.). Unfortunately, their installation and configuration takes time, and they’re not native to Jira, and that's before we mention the procurement process that takes months in some companies...
Did you know that Jira could also be used for Release and Environment Management?
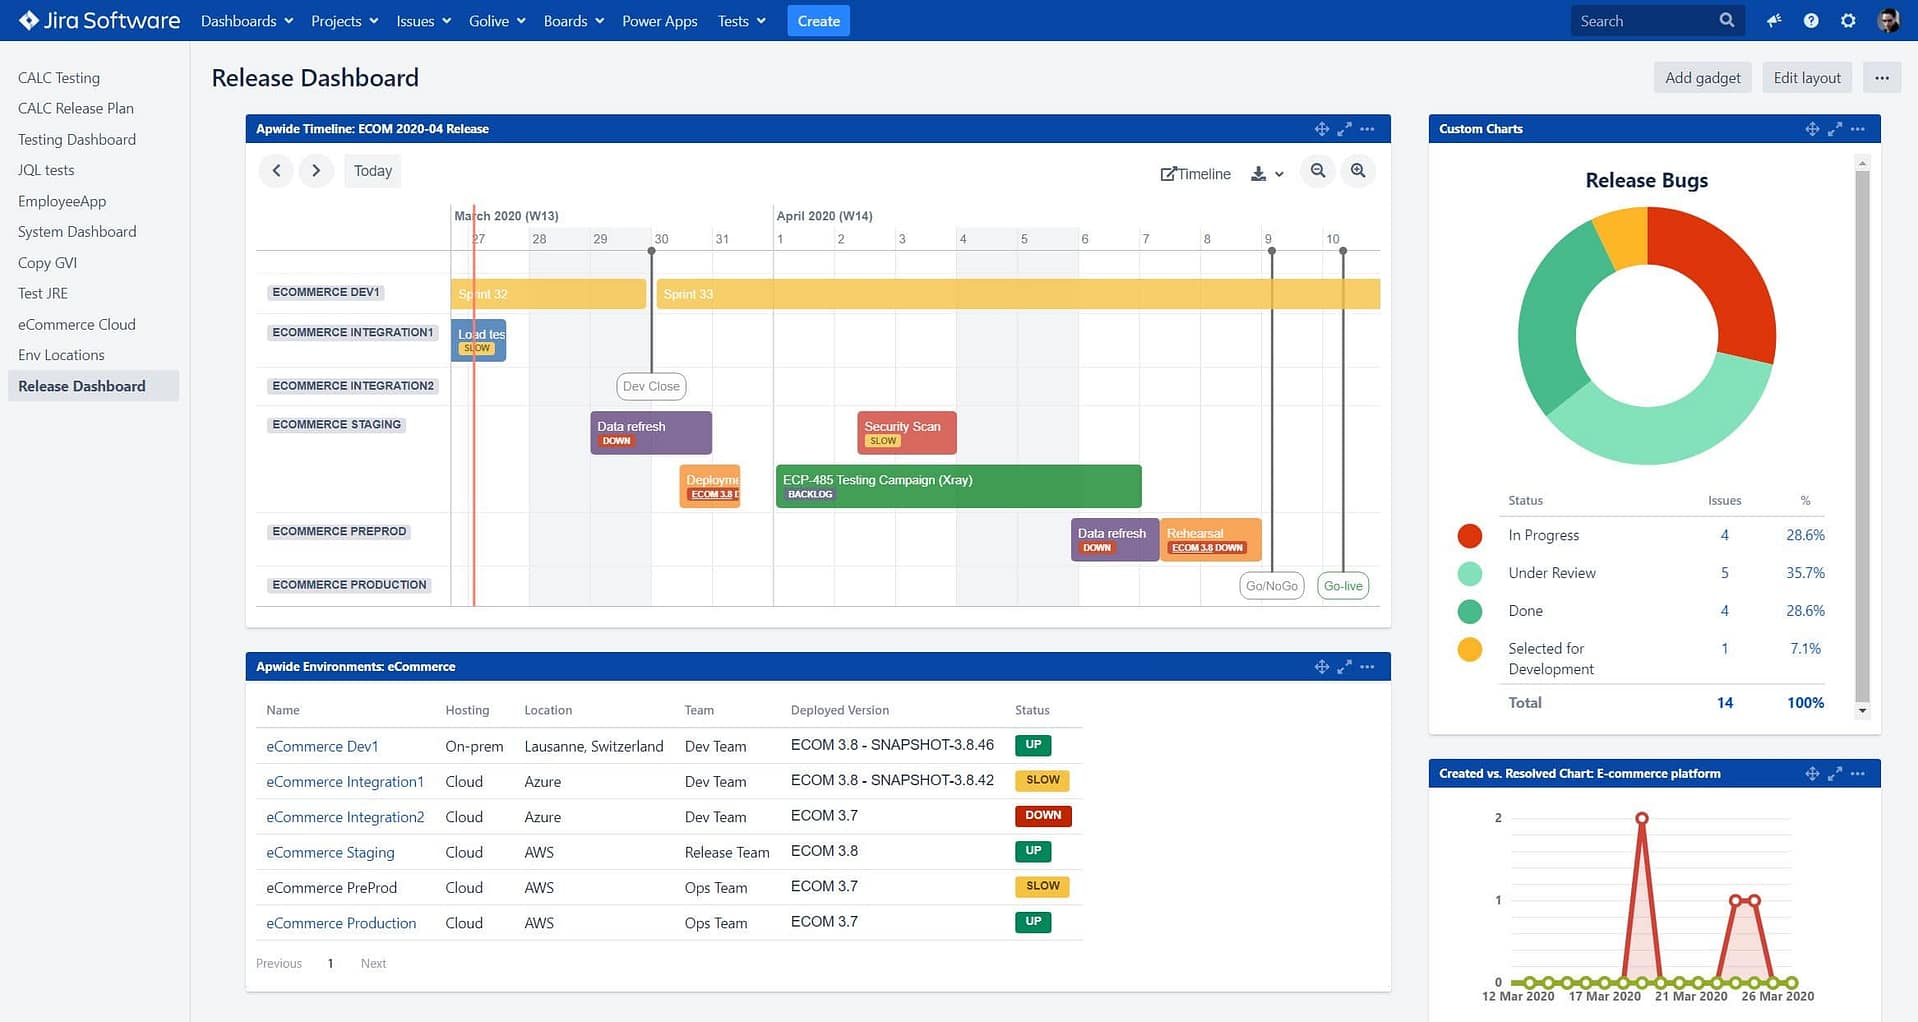
Apwide Golive is the #1 Jira app for Release and Test Environment Management, and allows you to build a Live Release Dashboard like this one:

Jira Release Dashboard built with Apwide Golive and Custom Charts
With these kinds of live dashboards, do you still need to keep your weekly status reports?
I'll give you a hint: YOU DON'T
What we’ve all noticed is that there are some smart team members, very aware of what’s possible with powerful tools like Jira, properly utilized. They manage to get all the relevant information from those tools but then... they copy-paste all the graphs into a Powerpoint.
Someone has to take the extra-step: move out of his/her comfort zone and start building a live dashboard that will aggregate all the relevant information.
A fully-automated dashboard collating information already available in Jira or other tools. Nowadays, there are easy ways to sync and transfer information from one system to another.
Yes, it takes a bit of time.
But hey, can you imagine the thousands of hours your team will save?
Key Benefits of Release Dashboards in Jira
A Jira release dashboard centralizes all the relevant information in one place, eliminating the need for constant email updates. Instead of sifting through long email chains to find the latest status report or meeting minutes, you and your team can simply refer to the dashboard. This live dashboard pulls real-time data from Jira, ensuring everyone has access to the most up-to-date information without the need for email notifications.
Moreover, an interactive dashboard allows for automated updates and alerts. For example, critical bugs, deployment statuses, and action items can be automatically displayed on the dashboard, providing instant visibility to all stakeholders. This automation reduces the need for manual email updates, improving communication and ensuring that important information is not buried in your inbox.
By consolidating release information into a Jira dashboard, you can significantly cut down on the number of emails exchanged, making your communication more efficient and less prone to oversight. This not only helps keep your mailbox manageable but also enhances team productivity and ensures smoother release cycles.
If you want to know how Release Dashboards will help you improve your communication, check our most recent free ebook.
Learn how Release Dashboards will help you master your communication.
Learn how Release Dashboards will help you master your communication.
And how do I build Smart Release Dashboards in Jira?
If building live Release Dashboard is relatively easy technically, there are still important skills needed in order to make it user-friendly for your audience.
Last but not least, do not forget to share the good news about your new dashboards, and ask for feedback from the teams that use them.
A live report published, but not advertised is useless!
Transform your Test Environment Management with Apwide Golive:
Leading companies have already Golive as part of their DevOps toolchain:


Free trial / Free forever up to 10 Jira Cloud users!

I truly enjoyed reading this article and discovered some valuable information. Thanks for sharing your insights with your readers.