Key Highlights
- Discover how to improve IT project status reports with modern tools.
- Learn to leverage Jira and Jira Apps for enhanced project tracking and reporting.
- Understand how to move from static reports to dynamic, real-time dashboards.
- Find out best practices for maximizing the effectiveness of your reporting tools.
As organizations grow, projects multiply, and reporting becomes harder to keep consistent. Traditional methods quickly break down because the information teams need is already in Jira, but not surfaced in a usable way.
Modern tooling as Apwide Golive can change that. When reporting is built directly on top of data teams that update every day, you get status views that stay accurate without extra admin work.
IT Project Status Reports
Live project status reporting is never just about dashboards. In large Jira instances, the real challenge is keeping data reliable, structured, and aligned across teams so that reporting stays trustworthy. Most organizations already track issues, releases, testing, and dependencies in Jira, but the reporting layer often breaks when workflows, fields, or environments are inconsistent.
This article focuses on how to build truly live status reports by using the information you already have in Jira and connecting it in a way that reflects the real project state, not a manually curated snapshot.
Configuration That Supports Reporting
Accurate reporting depends on a clear and predictable Jira configuration. When workflows, custom fields, and fixVersion structures follow the logic of your delivery process, data becomes easier to aggregate and interpret. This is especially important in organizations running multiple teams, multiple releases, or complex approval steps.
The goal is not to redesign Jira, but to make sure your configuration supports the questions that project and release managers ask every day: What is progressing? What is blocked? What is ready for testing? What is at risk for the next release?
Application Lifecycle Visibility
High-quality status reporting only works when information flows across the full lifecycle: development, testing, environment usage, release readiness, and incident follow-up. Jira already carries most of that data, but it is often scattered across different issue types, projects, and workflows.
Unifying this view is what makes dashboards meaningful. When issues, releases, tests, and environment activities are connected, project status becomes something you can trust at any moment, not only after a manual update.
Too often, it goes like this...
- 1Management finds a fancy report template and asks everyone to update it weekly.
- 2Teams email files around, upload versions to shared folders, or merge them into one giant document.
- 3The reports are presented once, then forgotten, and never fully up to date.
- 4Stakeholders end up asking for the real status directly, bypassing the templates.
If that feels familiar, there is a better way.
You do not fix reporting by improving templates. You fix it by using a system that already holds live project data. That system is Jira.
When workflows, fields, and releases are structured properly, Jira contains everything you need for real-time project visibility. And once dashboards are published in Confluence, sharing reliable status updates becomes as simple as sending a link.
Apps that improve live reporting in Jira
Once your reporting lives in Jira, the next step is choosing the right apps to fill the gaps that native dashboards cannot cover. Large programs often need cross-project rollups, better visualizations, environment tracking, release readiness views, or stronger automation.
The Atlassian ecosystem provides excellent tools for this. Some extend Jira's reporting capabilities, some improve planning and forecasting, and others give you visibility into areas like releases, dependencies, or environments that Jira does not handle natively.
Below are a few solutions I regularly recommend because they help replace manual reports with live, reliable project insights.
Golive - Test Environment Management
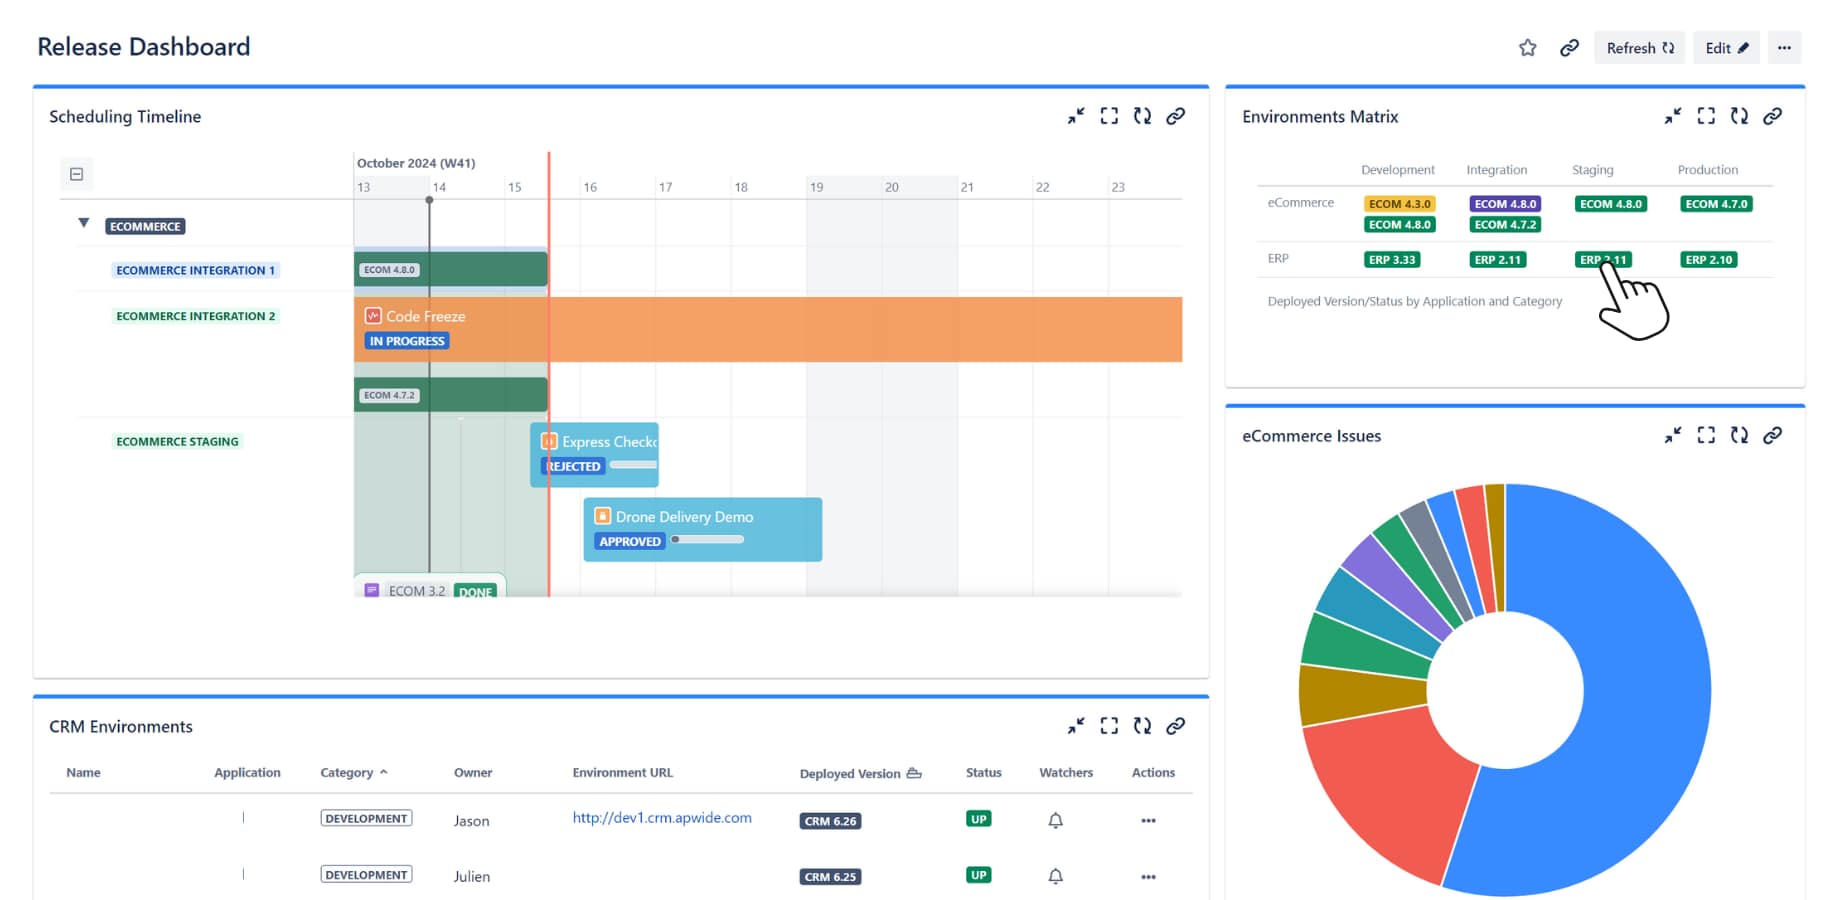
If you manage releases in Jira, Golive adds the visibility you usually miss on standard dashboards. It gives you a real timeline of what is happening across all environments: planned deployments, freezes, code cuts, validation windows, conflicts, and everything that affects your ability to deliver on time.
Release managers also get instant access to environment status, deployed versions, upcoming changes, and cross-team dependencies. The app consolidates releases, test environments, and deployments in one place, so your dashboards finally reflect the real state of delivery instead of scattered information across issues and spreadsheets.

Golive - Release Timelines and Test Environment Tracking
Projectrak - Project Management
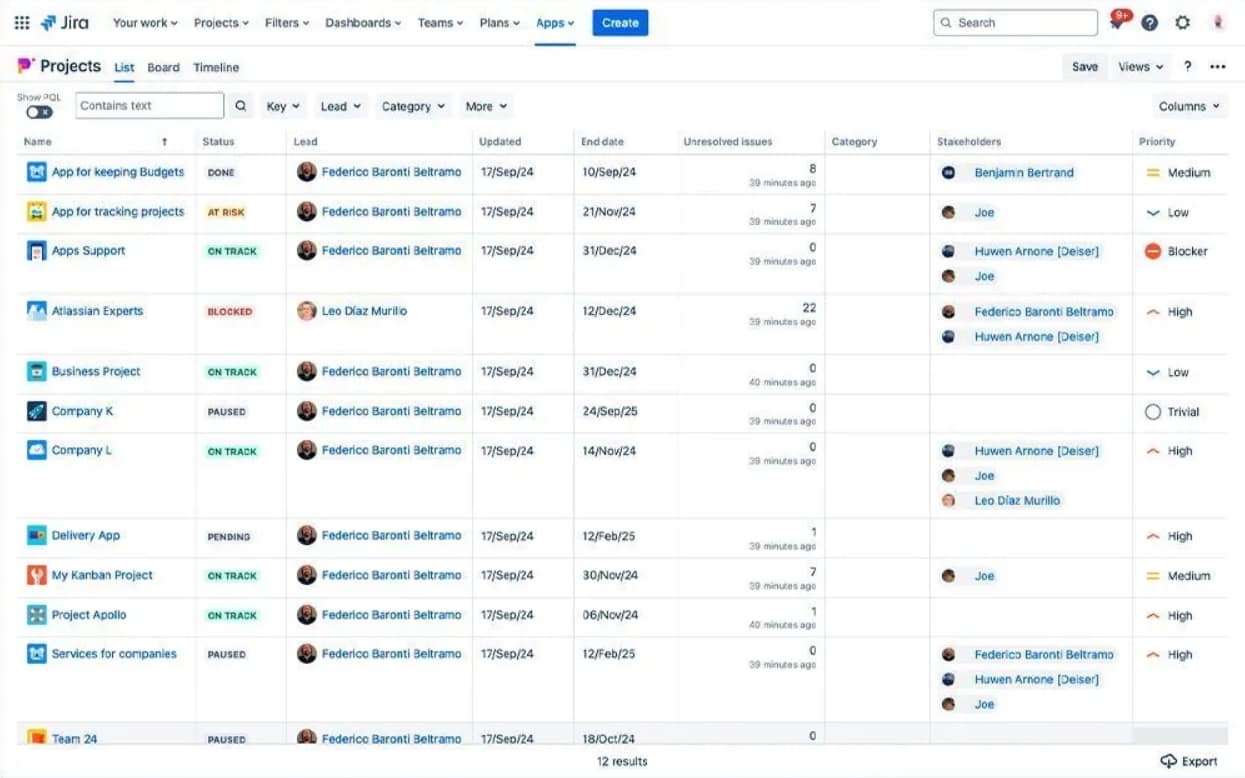
Jira gives you very limited reporting at the space (project) level out of the box. Projetrak fills that gap by letting you define custom space fields and track key attributes consistently across all your Jira spaces.
With Projetrak, you can centralize project metadata, create advanced reports, and surface insights through gadgets, notifications, and visual dashboards. It turns scattered project information into structured, reportable data that stays aligned across your organization.

Projectrak - Jira Spaces with additional attributes
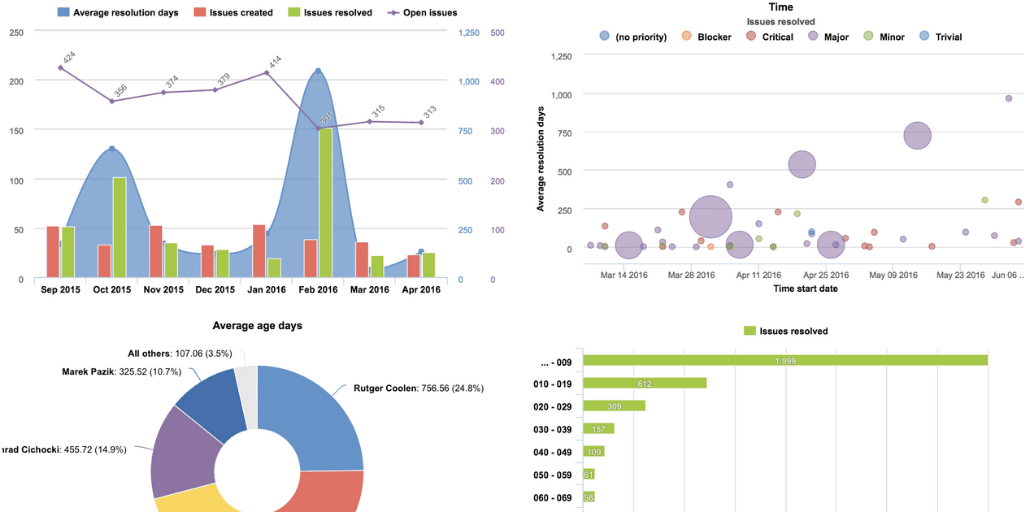
Custom Charts - Reports in Gadgets
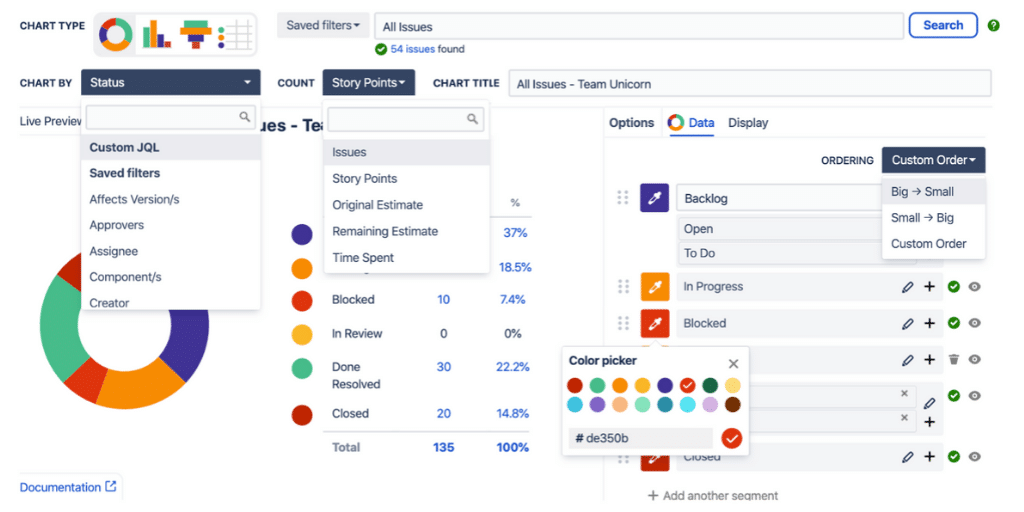
Custom Charts makes it easy to build clear, customizable dashboard reports without any complex setup. You can adjust fields, colors, and layouts directly from the editor, which helps teams create consistent, branded visuals in minutes.
Compared to EazyBI, which focuses on deep analytics and advanced calculations, Custom Charts is all about quick, intuitive reporting inside Jira dashboards. Both tools complement each other: Custom Charts for simple, flexible visuals; EazyBI for heavy data analysis and multi-dimensional reporting.

Custom Charts - Advanced reporting in Jira
Structure - Project Management at Scale
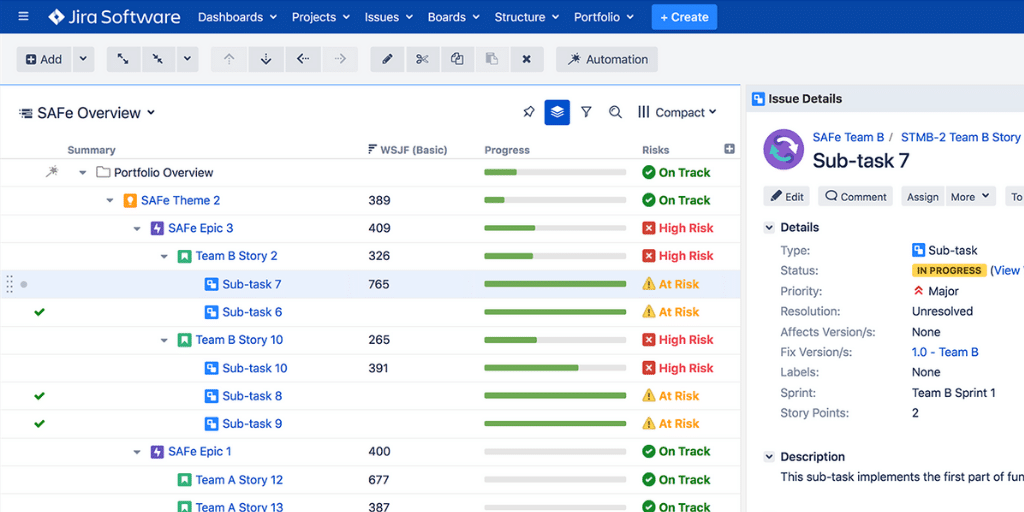
In previous roles, Structure was my go-to tool when I needed a clear hierarchy across epics, stories, and sub-tasks, with automatic rollups for estimates, story points, and progress. It is especially useful when you manage large programs or SAFe environments and need aggregated data that standard Jira views cannot provide.
If you work in a setup where visibility across multiple levels matters, the talk we gave at Atlassian Summit is a great reference: How Nespresso uses Jira Software for Release Management.

Structure - Use a hierarchy to aggregate data
eazyBI - Advanced Reports and Charts
If you need deep analytics on top of your Jira data, eazyBI is one of the most powerful options available. It loads a nightly snapshot of your Jira database and gives you a full analytical workspace to explore trends, build custom calculations, and create multi-dimensional reports.
From advanced charts to complex KPIs, eazyBI lets you combine fields, historic data, and custom formulas to answer questions that standard dashboards cannot address. It is ideal when you need long-term insights, portfolio-level metrics, or detailed reporting for leadership.

eazyBI - Powerful reporting capabilities for your Jira data
Now what? PowerPoint copy-paste?
With everything you've seen, it's clear you don't need to rely on templates, scattered files, or last-minute copy-and-paste sessions to communicate status anymore. The tools already connected to Jira can give you live, reliable information without the weekly scramble your intro described.
Building these dashboards is the easy part today. The real challenge is shaping them so teams understand the story behind the data and stakeholders know where to look. If you want practical guidance on that, I wrote an article on Live Release Status Dashboards that walks through the key principles.
And here is the final reminder: even the best dashboard is useless if no one sees it. Make it visible, share it regularly, and keep it part of the conversation. If you're interested in going further with Test Environment Setup and Management, our Essential Guide has everything you need to keep improving your reporting flow.