Key Highlights
- Understand how release burndown chart can provide a clear snapshot of your project’s progress.
- Learn to identify early warning signs in your burndown chart to keep your project on schedule.
- Discover how to use your team’s velocity data to make smarter, data-driven decisions.
- Explore how integrating Jira with Golive can simplify complex project tracking and improve release management.
Imagine climbing a mountain blindfolded, feeling your way forward with every step. Suddenly, someone removes the blindfold and hands you a map that shows exactly where you are and how much mountain is left to climb.
That’s exactly what the release burndown report is about: a simple, visual tool that tracks remaining work over time. This chart is like a progress meter for your team, providing a quick look at whether you’re on course or need to adjust. When used in Jira, the release burndown report gives Agile teams clear insights on whether a project will meet its deadline.
In this guide, I’ll explain how a release burndown chart can change how you monitor project progress and how Golive can add functionality for more complex projects.
But before we go through this, here are two important reminders:
Reminder: Keep in mind that Jira mixes the “Release” and “Version” terms. So, if you encounter “Version” while tracking releases, it’s essentially the same thing. You’ll find more details about this in Guillaume’s article about Best Practices for Release Management in Jira.
Reminder: If you’re familiar with the Version Report, you’ll notice some similarities with the Release Burndown report. While release burndown charts aren’t exclusive to Scrum, they’re handy for Scrum teams working in sprints, offering a straightforward way to track remaining work as you progress through your Sprint Backlog.
Why a Release Burndown Report Matters
Think of your project timeline like a mountain climb. You have a clear goal—the summit or release date—and every sprint is a step closer. But without a way to track progress, you’re climbing in the dark.
A release burndown report shines a light on your path, showing how much farther you’ve got to go. It’s a straightforward way for Agile teams to see remaining work across a project’s timeline, making it easier to make timely adjustments.
The burndown chart also shows trends, giving insight into how consistently your team is progressing. Are you on track? Will you reach the release date without a scramble at the end? This tool answers these questions and helps you spot potential delays early so you stay proactive.
Setting Up a Release Burndown Report in Jira
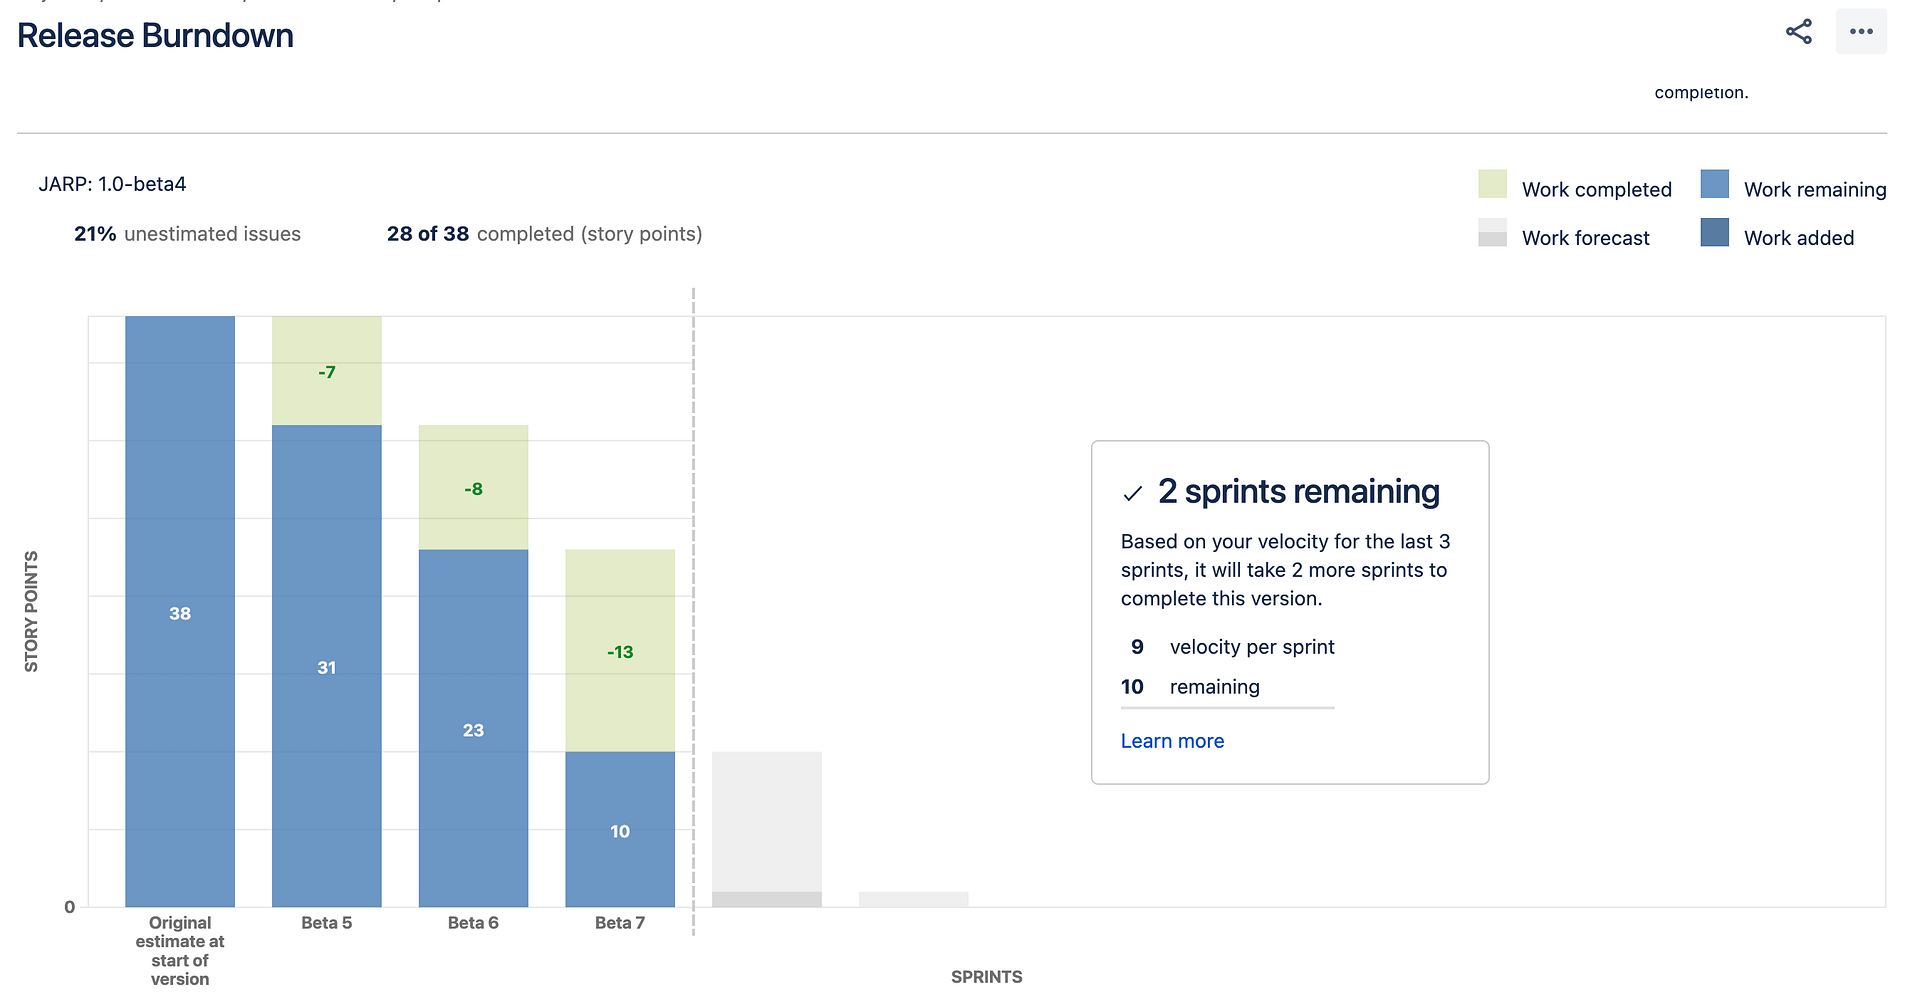
Getting started with a release burndown report in Jira is refreshingly simple. You don’t need any extra tools or spreadsheets. Here’s a quick walkthrough:
Release Burndown Report in Jira
- Navigate to Reports: Head to the Reports tab in Jira for visual progress insights.
- Choose Release Scope: Select the release you want to track. This sets up the report to display only the work items for that specific release.
- Interpret Results: Your release burndown chart is now ready. The X-axis represents time, usually broken down by sprints, and the Y-axis shows the remaining work.
You’re all set! The chart updates automatically after each sprint, giving everyone a clear view of the project’s status.
Making the Most of Your Burndown Report
A release burndown report is effective because of its simplicity. Each sprint shows your team’s velocity—how quickly they work through the backlog. Velocity gives a clear sense of whether adjustments are needed to keep progress steady.

Example of a Jira Release Burndown Chart
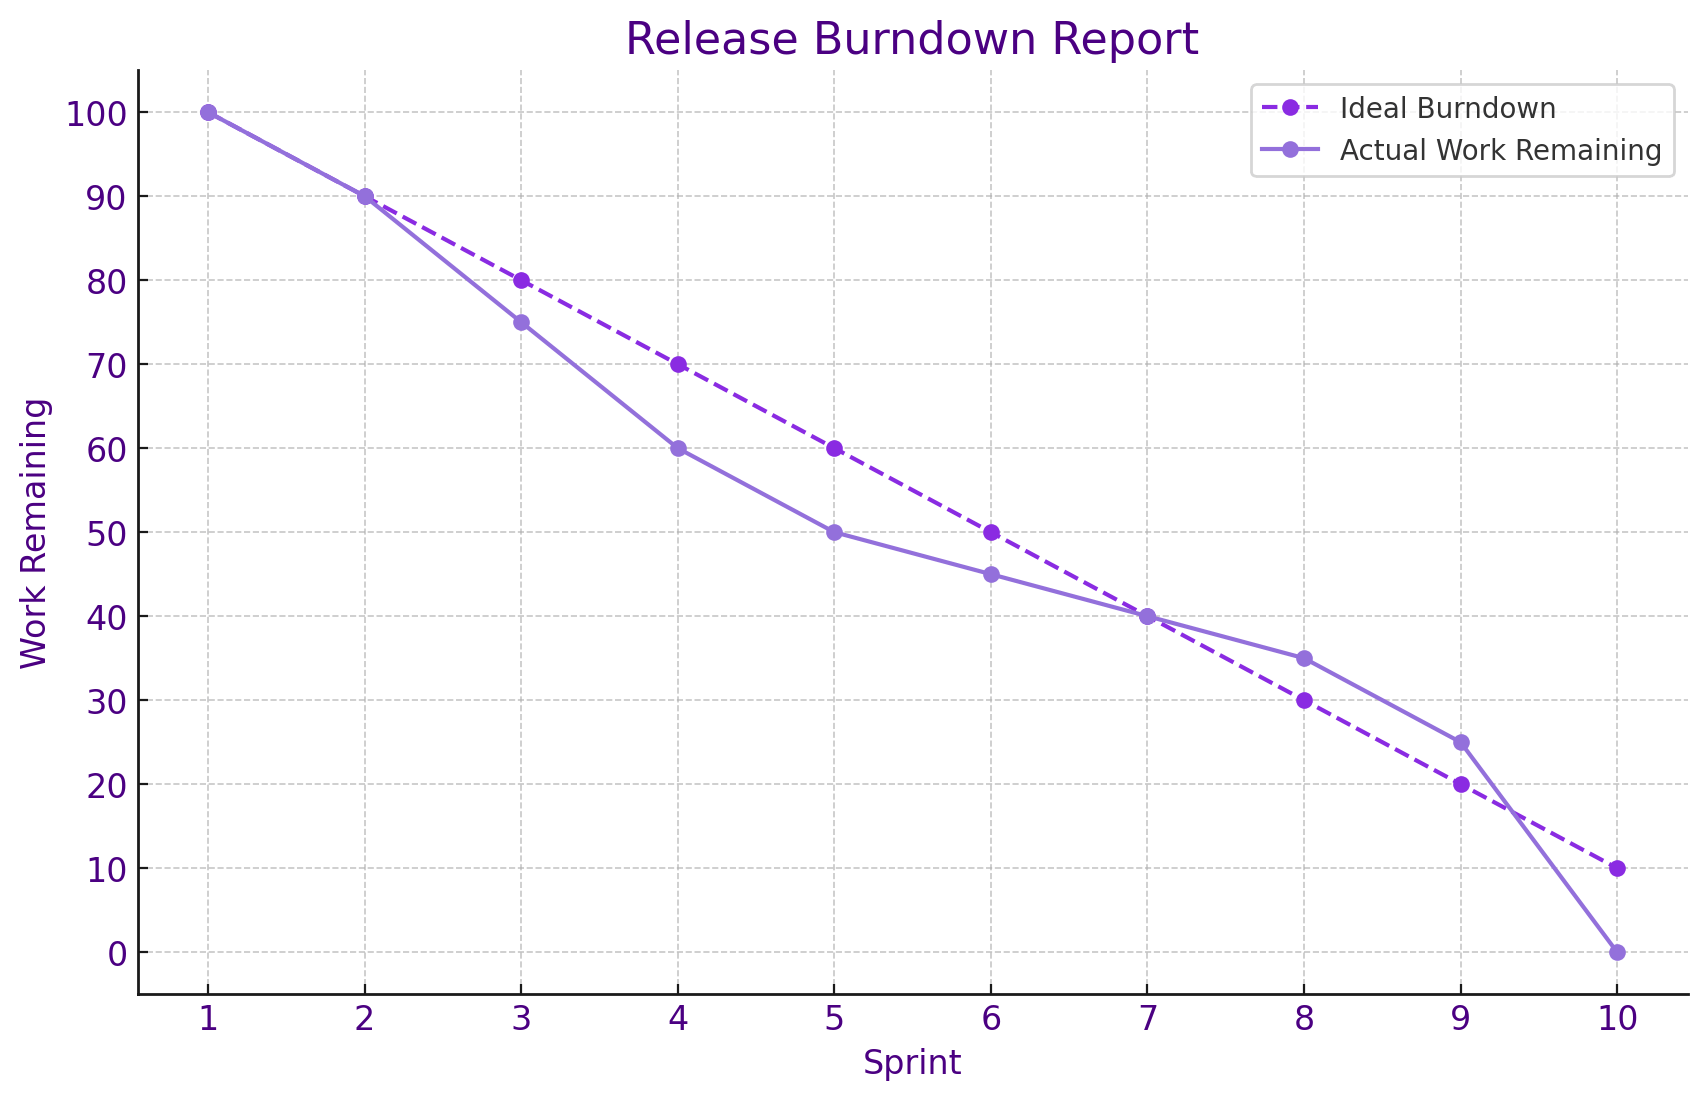
Imagine you’re managing a release with ten sprints. Initially, you load all tasks in the product backlog with estimates. After each sprint, you update the chart to show the remaining work. Ideally, the chart trends downward steadily toward the release date. But sometimes, things don’t go as planned. Maybe one sprint encounters unexpected blockers, or another goes faster than expected.
The chart captures it all, clarifying where the team might need more support or tweaks to hit the release date.
Practical Example: How It Works
Let’s say you’re working on a product launch. In the beginning, you list every task in the backlog with a rough estimate of effort for each one. Adding up these estimates gives you a total workload. As each sprint completes, you log the remaining work, watching the chart to see if you’re on pace.
After a few sprints, you start to see a pattern. Perhaps you’re ahead of schedule, or maybe you’re slightly behind. This is where the release burndown chart shines—it shows if your team is gaining momentum or facing challenges.
With this report, you’re better prepared to address any hurdles that come your way. It’s like having a GPS for your project’s progress, helping your team stay on track.

Example of Release Burndown Report Graph
How to interpret burndown reports
Here are a few examples of how to interpret burndown reports and what they reveal about a project’s progress:
Pattern | Interpretation | Recommended Action |
|---|---|---|
On-Track Progress | Team is on pace to meet the deadline | Monitor only |
Faster-than-Expected Progress | Ahead of schedule | Add scope or testing |
Falling Behind Schedule | Likely to miss the deadline | Reassess scope/tasks |
Fluctuating Progress | Inconsistent productivity | Improve estimations |
Scope Creep (Increasing Work) | New tasks added | Review new requirements |
Gradual Convergence Near the Deadline | Catching up after the initial delay | Encourage current pace |
These interpretations help turn the burndown report into an actionable tool, guiding project decisions based on the team’s real progress. Let me know if you'd like to explore specific scenarios more thoroughly!
When Jira’s Burndown Report Might Not Be Enough
While Jira’s release burndown chart is a great tool for tracking your release status, more complex releases will require added functionality. If you manage a project with multiple stages, environments, and dependencies, you might wish for extra features to manage all those details in Jira.
This is where the Golive Jira App can step in. Golive enhances Jira’s basic chart with a centralized test environment and deployment hub. Here are a few ways Golive can add value:
- Centralized Hub: Connected with your toolchain (GitHub, GitLab, Azure DevOps, Jenkins, etc.), Golive gathers all environment and deployment information in one view. You can monitor environments, handle deployments, and manage releases without manual updates. Everything is organized in one place, so you’re not constantly switching between tools or hunting for updates.
- Interactive Dashboards: Connected with your toolchain (GitHub, GitLab, Azure DevOps, Jenkins, etc.), real-time dashboards provide live updates across your QA environments and deployments, without manual data entry. You get an instant overview, helping you catch issues before they escalate.
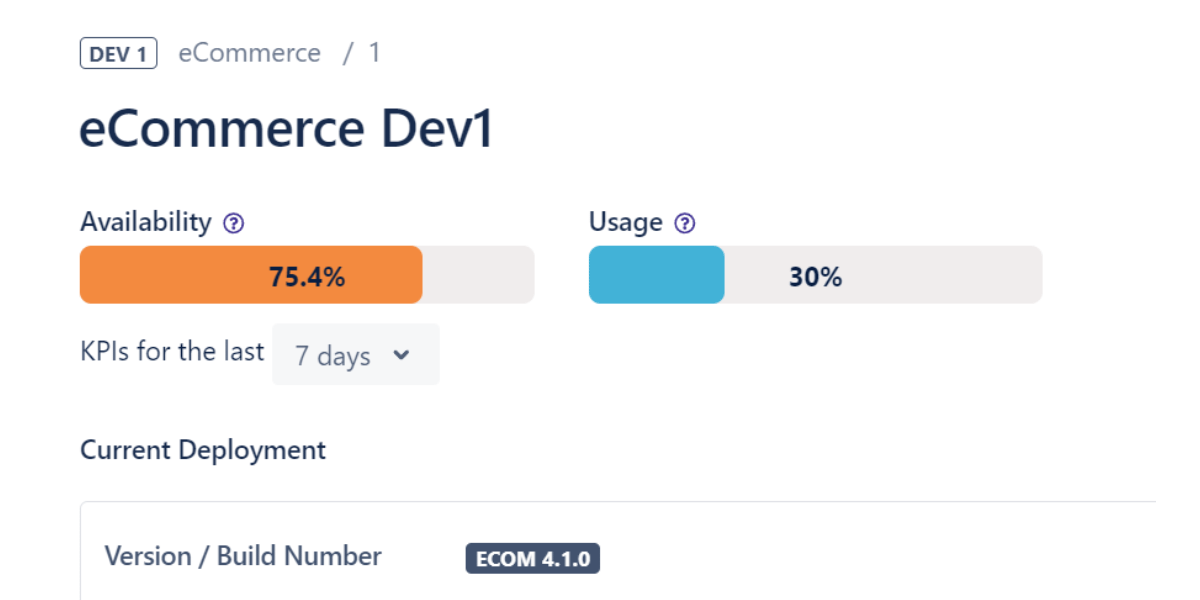
- Out-of-the-box KPIs: Golive provides built-in metrics like availability and usage, giving you actionable insights to optimize your environments and ensure smooth releases without the need for custom configuration.

Example of Environment KPI
Jira and Golive: A Strong Combo
Combining Jira’s intuitive burndown report with Golive’s expanded functionality offers the best of both worlds. Together, they simplify release management with both clarity and depth. Here’s how they work well together:
- Visibility Across Environments: Golive consolidates every aspect of environment and deployment management, giving a clear view of what’s happening. It tracks the deployment of Jira Versions across your test environments, additionally to the tracking of Jira issues, now available in Jira Cloud.
- Less Need for External Tools: Golive minimizes reliance on spreadsheets, shared calendars and other extra software. You can manage and track releases without additional support with both integrated tools.
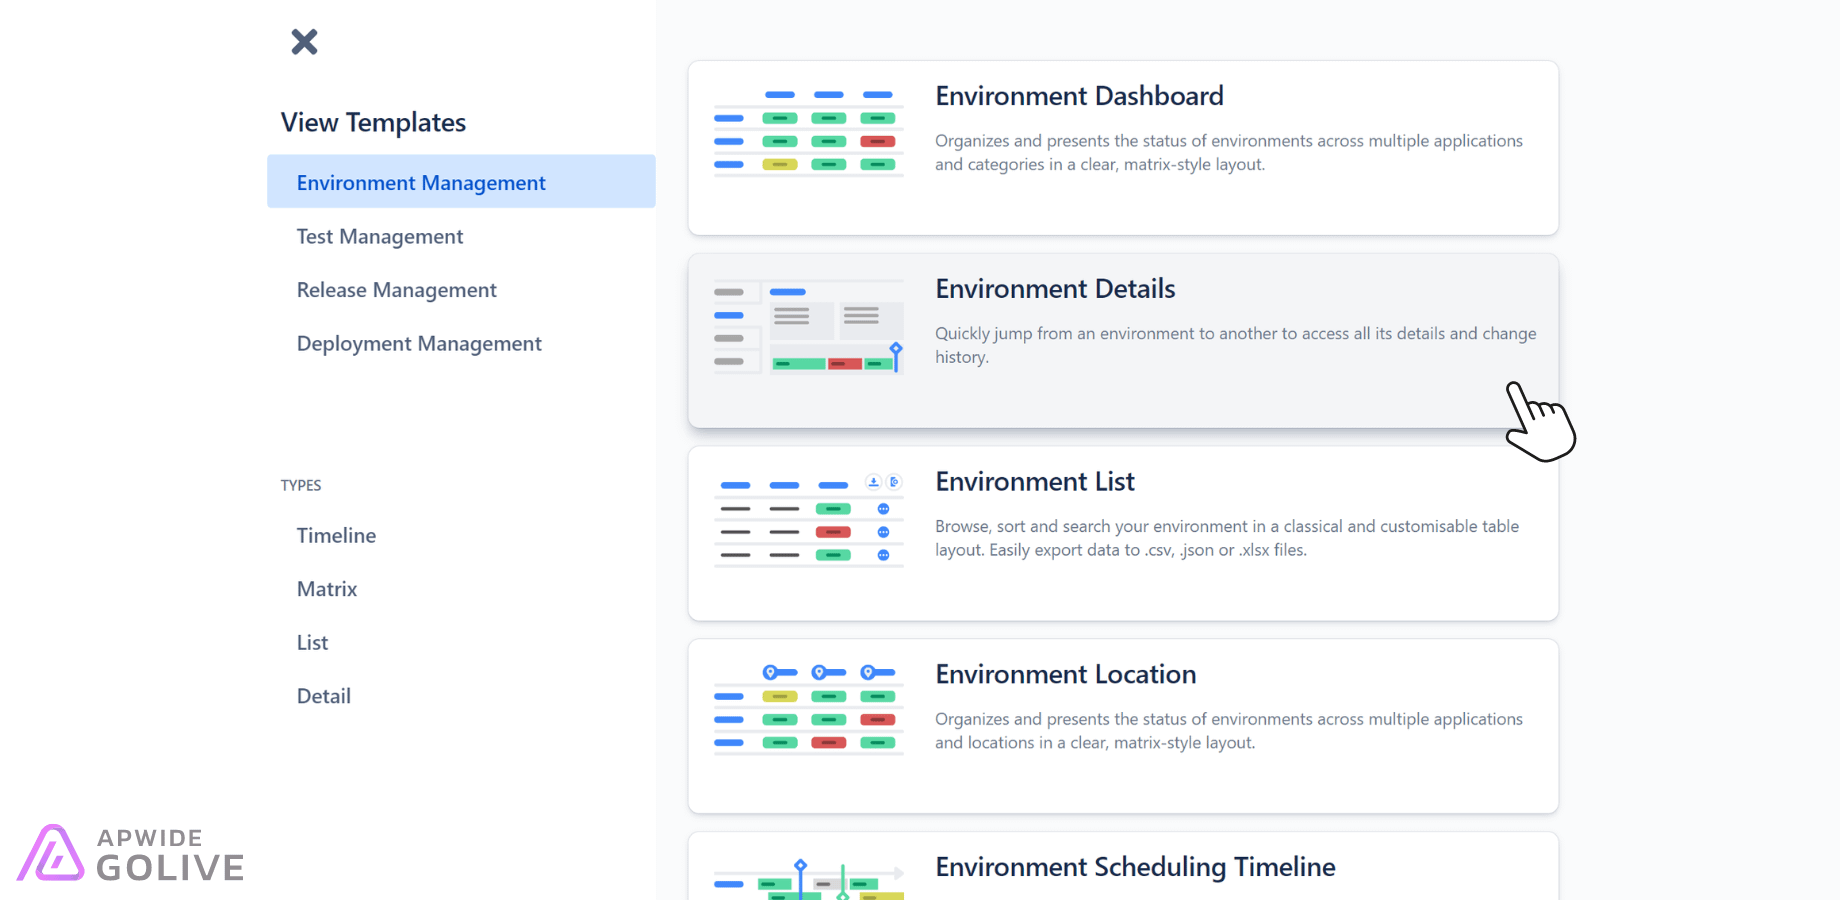
- Consistency with Templates: Templates make it easy to follow a standard process for each release, saving setup time and reducing room for error.

Examples of Golive App Templates
When to Rely Solely on Jira
Jira’s release burndown report alone might be all you need. If you have limited dependencies and a more minor team, the simplicity of Jira’s chart provides plenty of detail. Here are a few situations when just using Jira makes sense:
- Small Projects with Few Dependencies: Simple projects don’t need all Golive's extras. Jira’s built-in chart alone can work well.
- Basic Reporting Needs: Jira's default setup is often sufficient if your team isn’t managing multi-stage tracking or detailed deployment updates.
- Focused Agile Teams: Jira’s release burndown chart provides an effective, minimal approach for teams focused on task management within Scrum or Kanban workflows.
Learn how Release Dashboards will help you master your communication.
Final Thoughts on Golive and Jira
Tracking a release can feel like juggling multiple tasks, but Jira’s release burndown report simplifies the process, giving you a clear view of progress without the added stress. Golive enhances this experience for more complex projects with extra features to manage all the moving parts.
With Jira’s burndown chart and Golive’s advanced capabilities for environments and deployments, you can keep releases on track, maintain consistency, and reduce reliance on external tools. This combination empowers you to tackle even the most layered projects with confidence.
So, consider using the burndown chart in Jira when planning your next release. It might just be the tool you need. Golive’s integration can help keep everything organized for projects with more intricate requirements, aligning your team with project goals.
For a deeper dive into release management best practices and how to effectively utilize tools and improve processes, refer to our Software Release Management: Essential Guide.
Key Takeaways
- Burndown reports are tools for proactive release management. They help you identify trends early, keeping you a step ahead.
- Consistency is essential. Tracking sprint-by-sprint progress keeps the team aligned and aware of how close you are to meeting release goals.
- Data-driven adjustments minimize surprises. Analyzing team velocity and progress patterns enables smarter decisions and smoother releases.
- Jira and Golive together provide a comprehensive solution for release managers. This integration enhances visibility for tracking complex projects.
Transform your Test Environment Management with Apwide Golive:
Leading companies have already Golive as part of their DevOps toolchain:


Free trial / Free forever up to 10 Jira Cloud users!


